A Gantt chart visually tracks project tasks and deadlines, making it easier for professionals to manage their work. While many may want to create a Gantt chart in Excel but feel unsure where to begin, Excel is a great option for simple schedules, even though specialized project management tools are available.
This guide provides a step-by-step process for creating a Gantt chart in Excel, along with a free template for quick setup. Whether you’re overseeing a small project or managing a team task list, this method helps keep everything organized. You don’t need advanced Excel skills—just follow the steps.
For those seeking a ready-made solution, a downloadable template is available, saving you time and ensuring accuracy in your project planning.
What Is a Gantt Chart and Why Use One in Excel?
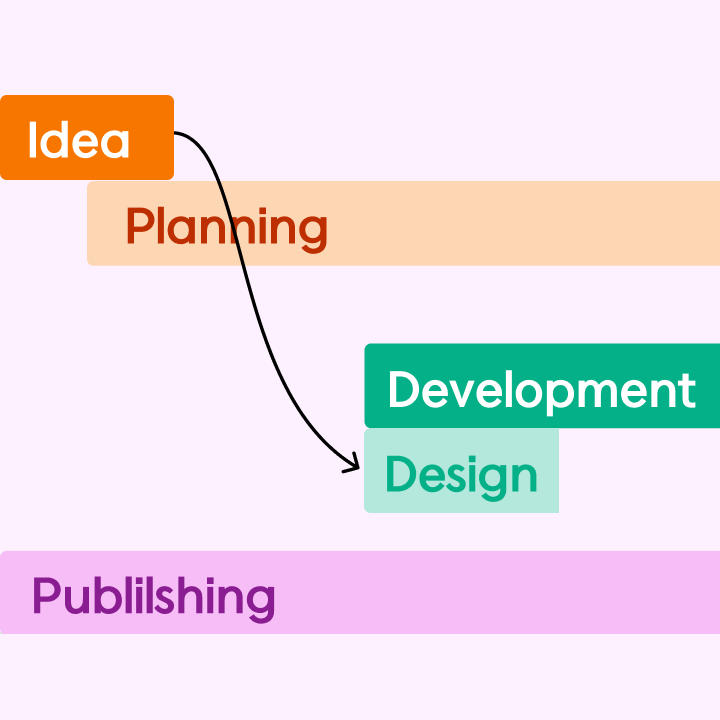
A Gantt chart displays project tasks as horizontal bars against a timeline. This tool gives teams visibility into due dates, work items, and dependencies. If you’re wondering, “Can you create a Gantt chart in Excel?” the answer is yes. While Excel doesn’t have built-in Gantt chart features, you can create one using stacked bar charts.
Excel is suitable for simple project tracking without the need for specialized software. It’s flexible, familiar, and cost-effective. However, for more complex projects, Excel does have some limitations.
Benefits of Using Excel for Gantt Charts
Excel is a practical choice for small to medium projects. Most professionals are already familiar with it, eliminating the learning curve. Users can easily modify colors, timelines, and tasks. Anyone with access to the software can edit Excel files, making it straightforward to create a Gantt chart.
Limitations to Consider
While Excel can manage simple schedules, it struggles with larger projects. It doesn’t automatically adjust timelines if dates change, unlike dedicated project management tools. Team collaboration can be challenging unless updates are made in real-time, and there’s no built-in feature for displaying task dependencies. However, learning to create an Excel Gantt chart can be a valuable skill for quick planning. If your project expands, you may want to consider switching to a more robust tool.
Step-by-Step Guide: Create Your First Gantt Chart in Excel
Building a Gantt chart in Excel allows you to manage a project without specialized software. This guide walks you through the process of creating a functional chart, including setting up a task list. The steps utilize basic Excel features, making it beginner-friendly. By the end, you’ll have a usable Gantt chart to track deadlines and progress.
Step 1: Create a Project Task List
Begin by listing all project tasks in an Excel sheet. Include columns for the task name, start date, end date, and duration. Adding a progress column will help you track completion later. Organizing your data clearly will ensure your Gantt chart functions correctly, and a simple layout makes future updates easier.
Step 2: Insert a Stacked Bar Chart
Select the task names and their start dates. Navigate to the Insert tab and choose a stacked bar chart. This will create the foundation for your Gantt chart, initially displaying start dates as blue bars. Subsequent steps will modify this to show tasks as horizontal bars.
Step 3: Format Your Excel Gantt Chart
Right-click on the blue bars and select Format Data Series. Choose No Fill to hide them, leaving only the duration bars visible. Next, right-click the task names on the left and select Format Axis. Check the option to reverse the order of categories, so tasks display from top to bottom instead of left to right.
Step 4: Adjust Dates and Timeline
Click on the dates at the top of the chart. Go to Format Axis and enter the minimum and maximum values for your project timeline. Adjust the major units to display weeks or months, keeping the chart clean and easy to read. Proper date formatting ensures accurate scheduling.
Step 5: Customize Colors and Labels
Assign different colors to the remaining task bars. Right-click on a bar and select Format Data Series to choose a color that matches your project style. If needed, right-click the bars again and select ‘Add Data Labels’ to quickly view the length of each task.
Step 6: Assign Tasks and Deadlines
Add team members or priorities to your Excel sheet. You can use color coding or additional columns to indicate responsibilities. This turns your Gantt chart into a comprehensive project tracker, helping to prevent confusion during execution.
Step 7: Track Progress Over Time
Enter completion percentages in the progress column. Add a new series to the chart to display progress bars, using a different color to represent completed work. Regular updates will keep the chart useful.
If you prefer a ready-made solution, a free Gantt chart template can save you time. Many customizable printable Gantt charts are available, whether you need a daily 6-week chart or a more complex project plan. Planning with an Excel Gantt diagram is straightforward.
Customize Your Gantt Chart Format in Excel
Excel enables users to tailor Gantt charts to meet specific project requirements. Simple formatting adjustments can enhance clarity and functionality, allowing teams to track their work more efficiently without needing to switch tools.
Adjust Time Scales (Hourly, Daily, Weekly)
The default Gantt chart in Excel typically displays days or weeks. For more detailed tasks, you can switch to an hourly view by modifying the axis settings. Right-click the date axis, select “Format Axis,” and adjust the major units. Daily views are suitable for most projects, while weekly scales are ideal for long-term planning. Hourly formats work best for shift schedules or tight deadlines.
Incorporate Progress Bars, Milestones, and Color Coding
Progress bars visually represent completed work. To add them, create a new data series for the percentage complete and format these bars in green to distinguish them from pending tasks. Milestones, which indicate key dates, can be added as diamond shapes above the timeline. Use color coding to organize tasks by team, priority, or type. Simply right-click any bar to change its color instantly.
Create a Reusable Gantt Chart Template in Excel
Save time on future projects by developing a Gantt chart template. Once you’ve set up your ideal format, save the file as an Excel template (.xltx). Include placeholders for tasks, dates, and teams. The next time you need a Gantt chart, open the template and fill in the new project details. This approach acts like a Gantt chart generator that you can reuse.
When to Use Excel vs. Online Gantt Chart Software
While Excel is suitable for many projects, it has its limitations. Knowing when to use it versus specialized tools can prevent frustration. Your choice should depend on project size, team needs, and required features.
Best for Simple, Offline, or Printable Plans
Excel excels with small teams and straightforward projects. It’s particularly useful when internet access is limited or when you need printable Gantt charts. Its familiar interface requires no training, making it ideal for basic tracking, personal projects, and one-time plans. The available Gantt chart templates cover most simple needs at no extra cost.
When to Transition to Dedicated Gantt Tools
Complex projects often require more than Excel can provide. Dedicated Gantt chart software is beneficial for managing multiple teams, frequent changes, or task dependencies. Online tools facilitate real-time collaboration that Excel cannot match, automatically adjusting timelines when dates change. Consider switching when your project involves more than 30 tasks or numerous team members.
For those seeking advanced features but preferring Excel, some add-ins function as Gantt chart generators. These tools enhance Excel’s capabilities while maintaining its familiar interface. However, for large-scale projects, dedicated Gantt chart platforms typically perform better.
The Excel Gantt chart approach suits many common scenarios. Its flexibility makes it ideal for quick plans and last-minute adjustments. However, as projects expand, specialized tools can save time and minimize errors. Understanding when to use each option helps teams work more efficiently. Both have their roles in project management.
Excel is a solid choice for temporary Gantt charts or short-term plans. Its format is easy to share as PDFs or printed documents. For ongoing, complex, or collaborative projects, online alternatives usually perform better. Your decision should be based on specific project needs and team workflows.
Start with Excel for simple Gantt charts. When your projects exceed its capabilities, it’s time to explore dedicated tools. Many teams successfully use both—Excel for quick plans and specialized software for larger initiatives. This balanced approach maximizes efficiency without incurring unnecessary costs.
FAQs About Gantt Charts in Excel
Can you create a Gantt chart in Excel 2016, 2019, or 365?
Yes, all modern versions of Excel (2016, 2019, and 365) support Gantt charts. The process is consistent—using stacked bar charts and adjusting formatting. No special add-ins are required. Excel 365 offers slightly improved visuals and templates, but the core functionality is available across all versions.
What’s the easiest Excel Gantt template for beginners?
The simplest template includes just three columns: Task Name, Start Date, and Duration. Pre-made templates with clear instructions are ideal for beginners. Look for templates labeled “basic” or “starter” Gantt charts, which avoid complex formulas while still providing a functional timeline.
How do I print a Gantt chart from Excel?
First, adjust the chart size to fit the page. Go to Page Layout > Page Setup and select “Fit to Page.” Preview your chart using File > Print to check alignment. For wider charts, change the orientation to landscape. Printing works best when the Gantt chart is the only element on a dedicated sheet.
Final Thoughts: Start Building Smarter Project Plans with Excel
Creating a Gantt chart in Excel is a practical way to manage projects without complex software. While it may lack some advanced features of dedicated tools, Excel offers sufficient flexibility for most basic to mid-level project planning needs. The process is straightforward: set up your task list, create a stacked bar chart, and customize it into a functional timeline.

For those seeking a quick solution, free templates provide ready-made structures that save time. Whether tracking daily tasks, weekly milestones, or long-term projects, Excel’s familiar interface makes it easy to adapt Gantt charts to various needs. The ability to print, share, and update plans keeps teams aligned without requiring special training.
However, as projects become more complex—with multiple dependencies, team collaborations, or frequent timeline changes—dedicated Gantt chart software may be necessary.
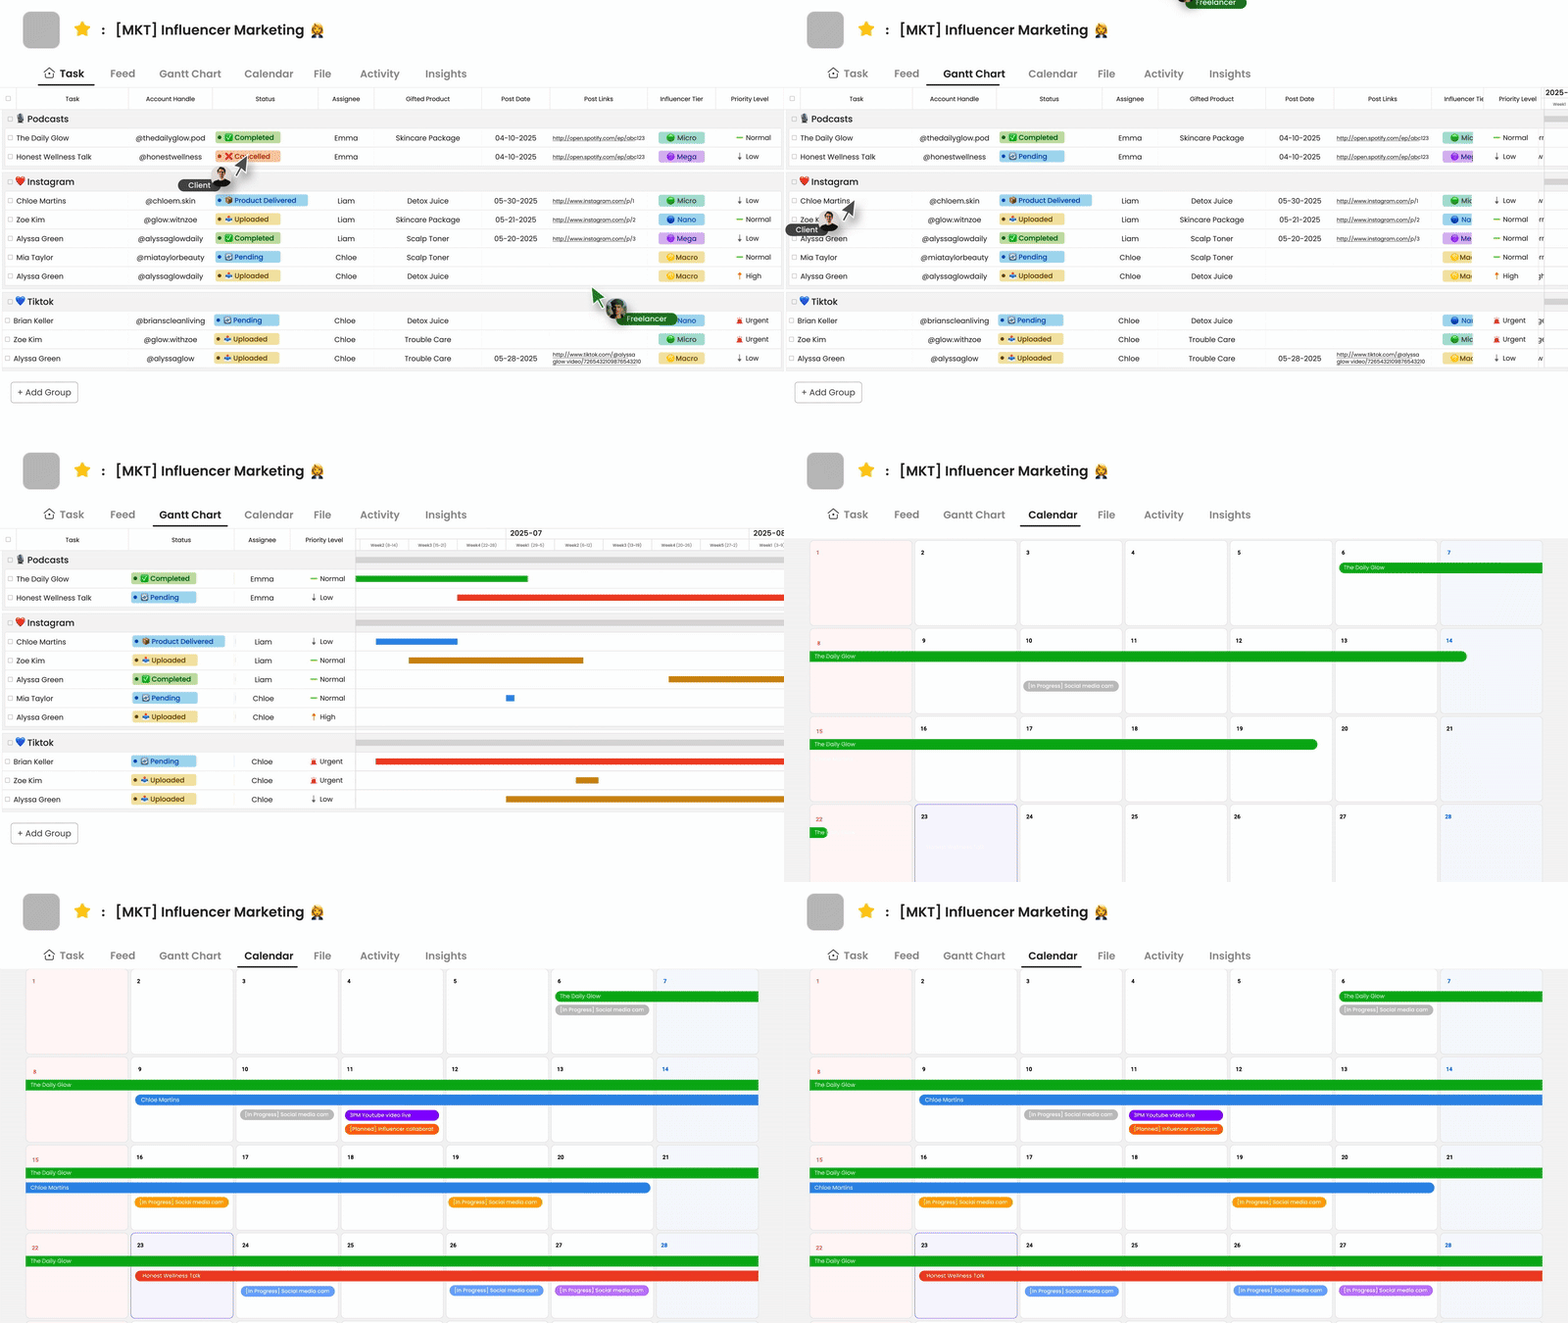
For a more streamlined and collaborative project management experience, consider using Morningmate. Morningmate offers intuitive Gantt chart features combined with task tracking, real-time collaboration, and calendar syncing, all designed to help teams stay organized and meet deadlines efficiently. Its drag-and-drop interface and customizable views make managing complex projects simpler, providing a powerful alternative to traditional Excel-based Gantt charts. Whether you’re working individually or with a team, Morningmate enhances productivity through integrated project planning tools tailored to modern workflows.


